2012 Year in Review – Battling the Challenges of Markets Unhinged
Battling the Challenges of Markets Unhinged
 We know that retirement plan investors need to focus on the long term performance of their investment portfolios. Changes in strategies, risk profiles, etc. based on short term moves in the market almost always lead to sub-optimal decision making.
What we witnessed in 2012 was a complete decoupling of market fundamentals and market performance. Gains in world investment markets were created by circumstances totally unrelated to the sales, earnings and dividends companies are generating or the interest rates sovereign borrowers are asked to pay.
Here are two examples of what we mean:
Bank Excess Reserves Remain Above $1.4 trillion
Banks have regulatory requirements on just how much capital they need to hold on their books to provide security for their deposit base. Capital on their balance sheets in excess of that amount may be accumulated for a variety of reasons (cushions against future withdrawals, etc.)
Reserves rarely exceeded $2 billion prior to the terrorist attacks of September 11, 2001. In that month, reserves rose to $19 billion for one month, then immediately retreated to less than $2 billion. Observers of the market at the time will remember how this was treated as a major liquidity event.
In August, 2008, excess reserves were $1.9 billion; they rose to $59 billion one month later, over $558 billion by November, and over $1 trillion by November, 2009.
Throughout the postwar period, banks have almost always loaned all the way up to their reserve requirement. The current failure to do so is disturbing at best.
Two factors of GDP growth remain in historic declines
Economic growth is driven by two simple factors – the number of productive people employed in the economy, and the amount of capital committed to maintain or increase their production.
A combination of cultural factors, including the increasing creation of the two-income family, pushed the participation of rate of our country’s labor force from 58% in 1948 to 64% in 1980. Participation increased gradually to a peak of 67.3% in 2000. That rate has now fallen to 63.6%. There are over 5 million people eligible to produce that are currently not producing.
We highlight elsewhere in this newsletter that the other factor, private capital commitments, is also in decline.
Less than two-tenths of 1% of the gains in the S&P 500 can be attributed to increased earnings for the companies in the index. The balance of the 16% gain comes from double digit increases in the price/earnings ratio, or asset-based inflation.
This era reminds us of similar circumstances in the Japanese markets in the mid to late 1980s, the U.S. market during the dot.com bubble in the late 1990s, and our most recent bout of inflation assets prices caused by the real estate bubble in 2006 and 2007. In each case, market euphoria created a flight to risk that destroyed investor fortunes when the risk was realized.
This latest game of market “chicken” will end the same as all of the others. The “when” is unknown, and may be further in the future than we expect. Prudent management dictates that we remain prepared.
As always, we truly appreciate the opportunity to work with our clients on their retirement goals.
-John Whaley, CFA
Partner/Research Director
 2012 Market Returns
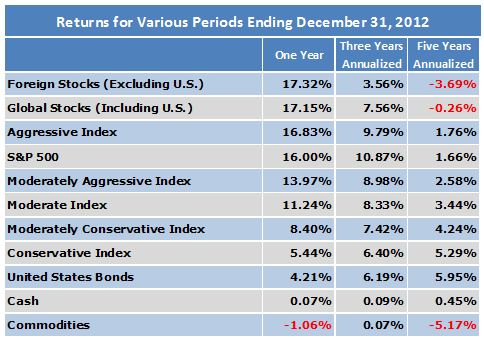
Market participants who bet that fundamentals do not matter were rewarded handsomely in 2012.
Double digit returns were experienced in both foreign and domestic equity markets. For the S&P 500, this represents the third year in the last four where gains above 10% were experienced.
Maybe even more surprising is the continued decline in interest rates. The yield on a 10-year U.S. Treasury Note has dropped from 3.36% at the end of 2010 to 1.97% in 2011 and 1.86% currently.
Over the past five years, the worst performing area of the market has been commodities, with a five year compound decline of 5.17%.
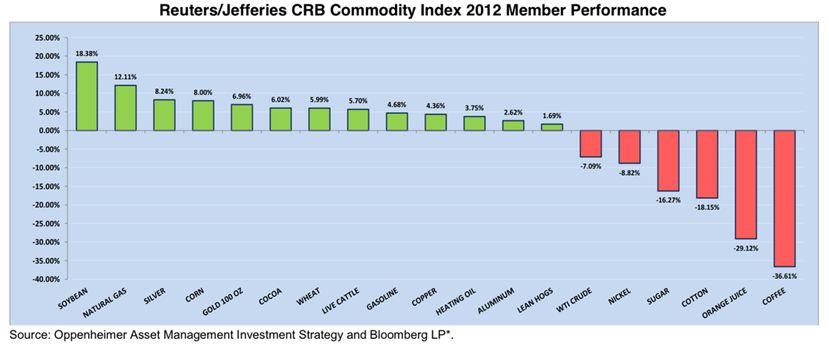
In 2012, the biggest declines were experienced in coffee (down 37%), orange juice (down 29%) and cotton (down 18%).
Soybeans and natural gas both rose by double digits, while the most widely watched commodity, gold, rose by 7%.
Basel Becomes Babel as Conflicting Rules Undermine Safety
“The first Basel agreement on global banking regulation, adopted in 1988, was 30 pages long and relied on simple arithmetic. The latest update, known as Basel III, runs to 509 pages and includes 78 calculus equations.
The complexity is emblematic of what happened over the past four years as governments that injected $600 billion to rescue failing banks during the worst financial crisis since the Great Depression devised ways to make the global banking system safer.
Those efforts have been stymied by conflicting laws, divergent accounting standards and clashing rules adopted by nations to protect their interests, all of which have created new risks.”
– Yalman Onaran, Bloomberg Business Week, 1/3/2013
Progress on Market Fundamentals
Over the long term, stock market values are driven by the ability of companies to generate additional sales, convert sales into profits, and convert those profits into additional sales through capital investment, or distribute those profits to shareholders. Below, we look at developments in each of those areas in the recent past.
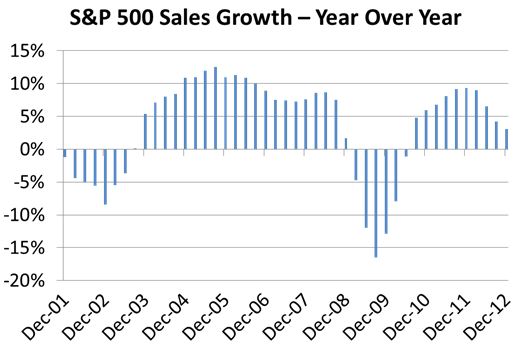
Sales per Share for S&P 500 Companies
S&P 500 sales grew an estimated 3.1% in 2012, down from 9.4% in 2011 and 6.0% in 2010.
The slowdown should be of concern to market investors. We took a look at the recovery in sales from the previous recession to the recession encountered at the beginning of this century.
Sales fell in 2002 following the terrorist attacks of the previous fall. Over the next five years, sales rebounded at a compound rate of 8.7% per year (stock prices rose at a 10.8% compound rate over that same period).
In contrast, sales from the latest recession have rebounded much more slowly. The five year compound rate of growth through 2012 is an anemic 1.1% per year. That growth is reflected in stock prices, which have fallen by -0.6% from the end of 2007 through December, 2012.
Profits per Share for S&P 500 Companies
Profit growth was even more anemic in 2012, managing just a 0.2% year over year gain. For the previous five years, the compound growth rate of 5.7% stands in comparison to the 19.1% growth rate experienced in the 2003 – 2007 period.
Corporations are dealing with the difficulties of maintaining historically high margins on their sales. For the last three years, “as reported” profits have exceeded 8% of sales per share. In recent history, only in 2006 did that margin exceed 8%. It only seems logical that margin pressures over the next few years will dictate even lower earnings per share growth.
Dividends per Share for S&P 500 Companies
Standard and Poor’s estimates that dividend payouts for S&P 500 companies reached $281 billion in 2012, a 17% increase over 2011, and 13.4% higher than the previous payout record of $248 billion in 2008.
A major factor in the acceleration of 2012 dividend payouts is the increased tax rate on dividends included in our new tax laws. To avoid higher tax rates for shareholders, corporations tripled the level of “special” payouts, pulling future dividend payments forward.
Corporations are estimated to have distributed 35.6% of reported income in the form of dividends in 2012, up from 30.4% in 2011, but below the 45.2% average of the last twenty years.
Capital Expenditures
Productive capacity is necessary to support sales and earnings growth. Here are the growth rates in this critical area:
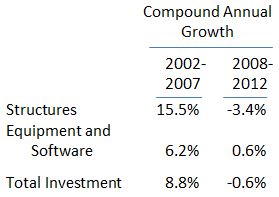
In 2000, there was $2.20 in private fixed investment for every $1.00 of federal expenditures. As of the latest measure, that ratio has dropped to $1.37 in private fixed investment for every $1.00 of federal expenditures.
Worldwide Sovereign Debt STILL at Unmanageable Levels
And the Band Plays On…
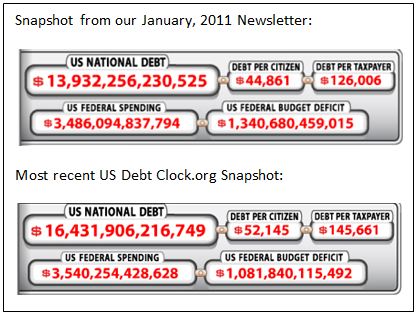 We saw no need to rewrite this article from our year end letter for 2011. We just marked it up with current figures…
We were stunned that the US National Debt was approaching $14 trillion at the end of 2010. Yet, look at the snapshots at the right. Federal spending twelve twenty four months later is UP, not down. Debt per citizens increased almost $4,000 $7,300 and debt per taxpayer is up over $9,000 $19,600 just one two short years.
Other incredible statistics from usdebtclock.org:
• Total Federal/State/Local spending has exceeded $7.0 $6.4 trillion dollars. That represents 46.7% 41.4% of US Gross Domestic Product.
• Total US Debt (households, businesses, governments and financial institutions) has reached $56.5 $58.1 trillion ($683,522 $732,166 debt per family).
• US Unfunded Liabilities (promises made for Social Security, prescription drugs and Medicare), now exceeds $117 $122 trillion, more than $1 million nearing $1.1 million for each taxpayer.
As we have stated on numerous occasions, we are fixated on worldwide debt levels for one important reason; more and more resources are being pulled from future productive capacity. As this continues, long term potential growth rates are reduced.
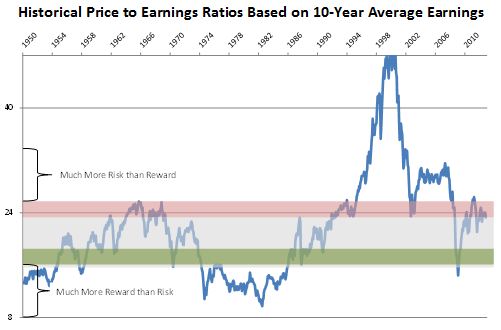
Market Valuations Remain High
The current price market participants are willing to pay for a dollar’s worth of earnings remains near traditional highs. The only periods where prices were higher were during the stock market bubble of the late 1990s and the real estate bubble of 2007 – 2008.
Accelerated levels of sales and earnings growth are needed going forward to justify these lofty prices.