November Newsletter – Recession in the Works for 2013?
Recession in the Works for 2013?
St. Louis Fed indicator may be clue – But what happens to our investments?
Information for this article comes from Lance Roberts, www.streettalklive.com, November 6th, 2012, and data from www.stlouisfed.org.

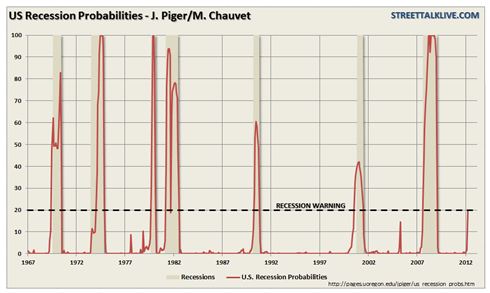
Investment professionals are raising red flags over a U.S. Recession Probabilities Index measure available at the St. Louis Federal Reserve website. The indicator spiked to near 20% with the latest release, from a level of less than 2% just one month previous. For reference, the last spike like this occurred in December, 2007, almost a full year ahead of the actual declaration of a recession by the National Bureau of Economic Research.
Of course, we are concerned about the economy, but we also need to understand if indicators like this point to future trends in the stock market and returns for your retirement portfolio.
Looking back to 1969, we find nine occasions when the indicator moved above 10%. Seven of those nine occasions called a recession that had already begun (and later acknowledged by the National Bureau of Economic Research) or was about to begin.
On five of those nine occasions, the U.S. stock market (as measured by the S&P 500) fell by double digits, with an average loss of -28.6% from peak to trough. On the other four occasions, the markets continued to move forward, with an average gain of 9.8%.
 Part of the difference in market behavior can be explained by the level of stock prices (versus corporate earnings) at the start of each of these events. A combination of higher valuation levels (where we are
currently) combined with a spike in the recession indicator foretold four of those five declines – only in 2005 did that correlation not exist.
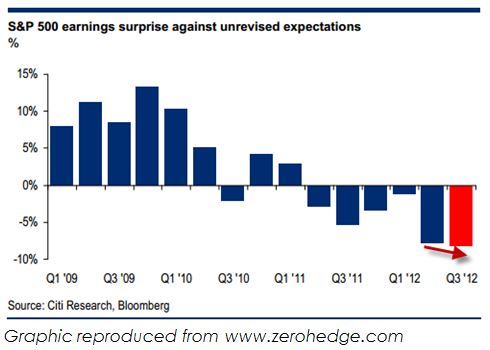
Corporate profit growth (the foundation for stock market returns) is rapidly declining. Should a recession develop (or should we be in one already), we would anticipate profits to decline 25% – 35% from current levels.
The combination of high valuations and declining profits will not provide a foundation for market gains in 2013. Our client portfolios have been positioned defensively for some time in anticipation of these developments.
Why the heavy focus on downside risk?
Revisiting the concept of average and compound returns

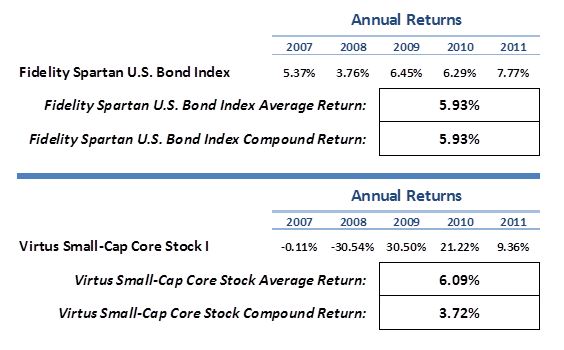
The investment industry often makes the mistake of highlighting average returns when discussing investment options with clients. Below is a chart to remind us that average and compound returns are two different animals, and the difference is significant to your portfolio.
Over the last five calendar years, the Virtus Small-Cap Core Fund has averaged slightly higher returns than the Fidelity Spartan U.S. Bond Index Fund. However, the compound return of the bond fund is more than two percentage points higher than the stock fund. For a $10,000 portfolio, that amounts to over $1,300 in excess returns.
Minimizing the losses during bad performance periods significantly helps the long term investor reach their financial goals.
CFA Institute Integrity List:
50 Ways to Restore Trust in the Investment Industry
Following the 2008 financial crisis, and on the occasion of the Chartered Financial Analyst Institute’s 50th Anniversary, they published the Integrity List; 50 ways to restore trust in the investment industry. Last month, we offered up the first ten, here are numbers 31 through 40:
31. Disclose information in ways even novice investors can understand.
32. Adopt Global Investment Performance Standards.
33. Maintain regular contact with clients.
34. Openly share bad news with all who are affected.
35. Listen to clients’ concerns and fears.
36. Promote the concept of earning money rather than making money.
37. Create an ethical work culture that allows constructive criticism.
38. Bring an ethical dimension to discussions of business strategy.
39. Adopt the CFA Institute Asset Manager Code of Professional Conduct.
40. Remind junior associates that reputations are hard earned and easily lost.
