2015 Ends as a Wash for Investors
January 2016
After All the Twists and Turns, 2015 Ends as a Wash for Investors
But That Should Not Impact Your Savings Strategy
Whether you look at the returns by different types of investments shown on the right, or just take a peek at your retirement account statement when received, you know that last year was not good for long term investors. There were some hiding spots, like large, growth-oriented companies, or companies in specific industries, like health care. But most accounts that invest in a diversified mix of stocks, bonds and cash lost value in 2015.
A reaction we often hear from retirement investors goes along the line of this: “Well, if I can’t make any money in my investments, why should I continue to contribute?”. The answer is simple – growth in your retirement account comes from two sources, the amount of money you and your employer contribute, and the amount that comes from the return on your investments. Investments returns will be volatile, but contribution growth should be steady and long-lasting.
Suppose you decide you want to accumulate $750,000 in your retirement account by age 65. (Warning! For many, $750,000 may be enough, but for some, a larger number may be necessary.)
If you are 35 and have an account balance of $75,000, here’s how you get to $750,000 over the next thirty years*:
- Current Balance $75,000
+ Total Contributions $187,620
+ Investment Gains $487,380
= Balance at Age 65 $750,000
If you are 50 and have an account balance of $300,000, here is your path over the next fifteen years*:
- Current Balance $300,000
+ Total Contributions $85,665
+ Investment Gains $364,335
= Balance at Age 65 $750,000
Investment gains, particularly from your stock funds, will be volatile from year to year and everyone will have years like 2015 or worse. But meeting your contribution target is completely unrelated to those gains. You can meet that target through consistent deferrals year after year, whether or not your portfolio meets the annual return target.
* Presented for illustration purposes only. Investment gains are generated an assumed compound rate of return of 5% annually. Compound returns for a balanced portfolio (60% stocks, 40% bonds) have approximated 5.97% over the last fifteen years, before any investment expenses and other related fees.
________________________________________________________________________
Dissecting the Components of Stock Market Returns
The returns investors receive from an investment in a common stock or a stock fund are driven by three basic components: the change in earnings generated by a common stock (or a portfolio of stocks), the change in prices investors are willing to pay for those earnings and the amount of dividends companies are willing to pay to investors.
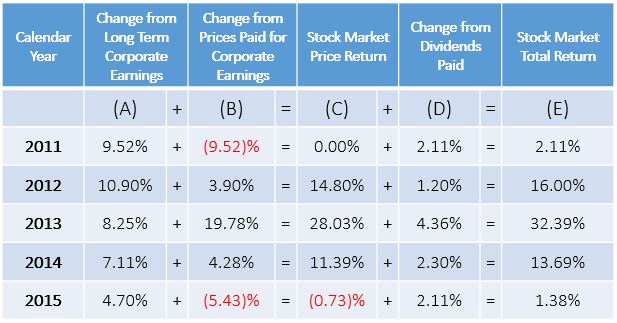
Below is a chart of the previous five years of returns for the S&P 500:
When developing our long-term investment strategy, including the amount of money each investor should place in the stock market, we monitor this data closely.
Of least concern is Column D (Changes from Dividends Paid). In the aggregate, corporations are consistent when it comes to rewarding investors with an annual return on their investment through a dividend payment. This column is consistently positive in the 2% – 3% range.
Column A (Changes from Long Term Corporate Earnings) is more volatile that dividends paid, but remains overwhelmingly positive through the course of history. In general, the contribution to total returns from Column A is in the 6% – 7% range, so we do get concerned when we see a year like 2015 when that contribution fell to only 4.70%.
What keeps us awake at night is the volatile nature of Column B (Changes from Prices Paid for Corporate Earnings). This is where we see the impact of investor opinions, economic conditions, and the short term impact from high frequency traders and institutional investors. Look at the results from 2008, for example:
(A) + (B) = (C) + (D) = (E)
2008: 1.72% + (40.21)% = (38.49)% + 1.49% = (37.00)%
We know from reviewing decades of stock market history that Column B tends to generate a negative contribution when prices investors pay are historically high to begin with. That is where we remain as we enter 2016, and why we continue to maintain our client portfolios on the very conservative side of their long term strategic allocation.
If you are working with our service, you can review your strategic allocation as part of your annual Investment Policy Statement. If you are not our client, and you do not have a strategic allocation (or your advisor hasn’t developed one for you), now is a great time to contact us.
________________________________________________________________________
Stocks By Degree of World Stock Market Risk*
20% Market Risk -0.63%
Dow Jones Conservative Portfolio Index
40% Market Risk -1.11%
Dow Jones Moderately Conservative Portfolio Index
60% Market Risk -1.21%
Dow Jones Moderate Portfolio Index
80% Market Risk -1.89%
Dow Jones Moderately Aggressive Portfolio Index
100% Market Risk -2.56%
Dow Jones Aggressive Portfolio Index
• Dow Jones Relative Risk Indices are total portfolio indices that allow investors to evaluate the returns on their portfolios considering the amount of risk they have taken.
Other Asset Classes
Real Estate Investment Trusts +2.83%
NAREIT All Equity REITs Index
Investment Grade Bonds +0.55%
Barclays US Aggregate Bond Index
Money Market Funds +0.02%
Average of 1,100+ Money Market Funds as reported by Morningstar
High Yield (“Junk”) Bonds -4.47%
Barclays US Corporate High Yield Index
Emerging Market Stocks -10.12%
Morgan Stanley Emerging Markets Index
Commodities -24.66%
Bloomberg Commodity Index
________________________________________________________________________
Download PDF


