April Newsletter: An Exceptional Quarter and the Monetary Base
Headlines Tout Largest First Quarter Gains in Years!
What Happens Next?

How can we not be excited! The S&P 500 rose 12.6% over the first three months of this year, the best start since 1998. Foreign stocks rode along, with an 11% gain since December 31st.
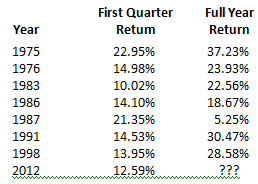
Over the last 40 years, the record hints that there is more good news ahead. Let us look at what happened in the seven years when first quarter market gains exceeded 10%:
Only in 1987 did the full year returns fall below the returns in the first quarter. Investors were overwhelmingly rewarded by sticking with equities during those years.
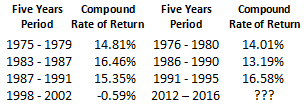
Of course, we are concerned with longer term returns for retirement accounts, so here are the five year returns for periods starting with those years:
During six of those seven five year periods, investors enjoyed double digits compound rates of return. A consistent presence in the equity markets would have provided dramatic progress toward a successful financial retirement. Is there something different during last five year period we should pay attention to?
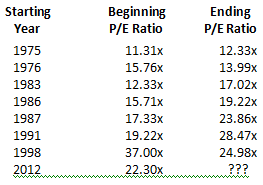
 Starting points matter! The average price investors have been willing to pay for earnings historically is $20.52 for every dollar of earnings (20.52x). Notice that the first six periods (all positive return periods) started below that average, while the only negative return period started above the average level.
In fact, with the increases we saw in the first quarter of 2012, the current P/E ratio is over 24x. Only in the 1990s, an era of inflated prices did any of these periods end above this level.
Unless we want to bet that the dot.com era is back, we have to believe the odds are not in the favor of outsized returns over the next few years. Caution remains warranted.
The Monetary Base
To Infinity and Beyond……
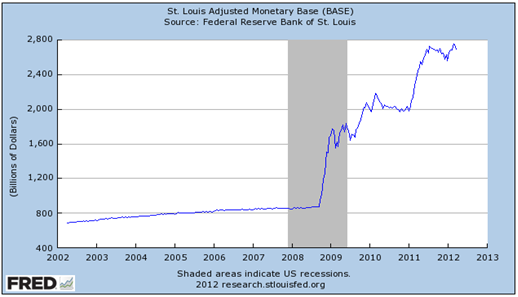
The U.S. Federal Reserve, along with several other central banks around the world, has adopted an aggressive monetary expansion policy in recent years to stimulate consumer demand. This is done by adding additional money (cash) to the markets in the hopes of stimulating spending. More money, equals more spending, which equals more demand, which then produces productivity growth, or so the theory goes. The graph below highlights the change in the supply of U.S. dollars for the past decade. Note the magnitude of this growth as it relates to the earlier years of normal economic expansion.
As investors we must understand that more money does not necessarily equal more wealth. There is a significant risk that growth in wealth in the coming years will flounder because of an increase in consumer and commodity prices – better known as inflation. Drastic rises in the money supply has been a precursor to rapid inflation in the past – look no further than the hyper inflation period in Germany post WWI. If inflation outpaces real growth in wages, the U.S. economy has stagnated even though appearing to do well in terms of growth in asset prices. Remember, price and wealth are independent of each other: an increase in prices does not mean an increase in wealth.
Traditionally, ownership of equities and equity funds offer a hedge against inflation, as long as inflation remains within a reasonable range. We know, for example, that inflation rates that exceed 4% often impact the ability of companies to maintain the profit margins necessary to support stock prices. The normal progression from significant increases in the monetary base to significant increases in the cost of living gives us cause for concern.
Investors with longer time horizons have the ability to assume greater exposure to assets of ownership as a hedge against the potential effects of normal levels of inflation. However, true wealth expansion (the increase of your purchasing power) is often not achieved when monetary policy is out of control.
The Pulse of Commerce
The Ceridian Pulse of Commerce Index, provided by the UCLA Anderson School of Management, measures the amount of diesel consumed by the road trucking industry. The index monitors movement of produce, raw materials, and finished goods.
The index posted a .7% increase for the month of February from January. However, the index is showing signs of stress in the economic recovery. The first quarter of 2012 is on track to show a reduction in over-the-road commerce from the fourth quarter of 2011. The index will have to post a gain of 4% in March to equal the fourth quarter volume of commerce.


