BeManaged Year End Newsletter – 2011 Was a Treacherous Ride to Nowhere
Conservative Investors Rewarded in 2011
A treacherous ride to nowhere
 Pretend for a moment you pulled off your best Rip Van Winkle imitation and slept through 2011. You pick up a “Year in Review” newspaper, and find out:
- A number of European countries (Portugal, Italy, Greece, Spain) are close to defaulting on their debt.
- The United States ran up another $1+ trillion in debt and lost its’ AAA credit rating.
- Over 13 million Americans remain unemployed. Another 8 ½ million are working only part time because they cannot find full time work.
You would have to believe your investments took a beating. Yet, you open up your retirement plan statement and find out things weren’t quite as bad as you expected.
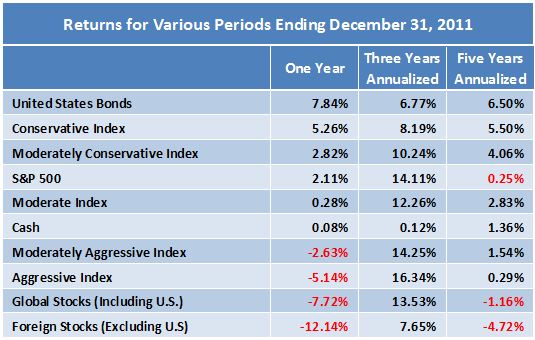
Nobody made a bundle of money last year. If you owned mostly stocks, and mainly foreign stocks, you lost 4% or more. Conversely, if you emphasized bonds and cash in your assets, you managed to eke out a small gain (1% – 2%) – not enough to meet your long term needs, but enough to protect your principal in anticipation of better times ahead.
We were pleased to see that corporate earnings and dividend payments increased significantly last year. Earnings and dividends provide the basis for long term rates of return that can meet your retirement needs.
On the negative side, we went from historically low interest rates at the beginning of the year to ridiculously low levels today. Savers and retirees are unable to find income producing investments without accepting significant risk.
We remain extremely concerned with subpar growth in our nation’s level of output. If our shift to lower growth rates (which began almost a decade ago), is more permanent than we thought, even conservative projections of 5% long term rates of return will be called into question.
We discuss our thoughts for the next year on the following pages. We enter 2012 the same way we entered 2011, with a very cautious outlook.
Investment Professionals Weigh In on Market Outlook
The CFA Institute recently published their 2012 Global Market Sentiment Survey. The report analyzes responses to a November, 2011 survey of over 58,000 CFA Institute members across the globe. Among the findings:
- The current global financial crisis has severely impacted market trust and confidence. Almost 80% of U.S. respondents expect this low level of confidence to last at least three more years
- 52% of survey participants expect the sovereign debt crisis to get worse in 2012
- Mis-selling of financial products by advisers is perceived to be the most serious issue facing global markets
Globally, 59% of respondents predict that asset classes other than equities will be the top performers in 2012. The majority of U.S. respondents (56%), however, believe the equity markets will outperform other asset classes.
The full Global Market Sentiment Survey for 2012 can be found at the CFA Institute website (www.cfainstitute.org).
2011 Market Returns Mixed
Foreign stocks suffered significant declines
 It was indeed a wild ride for the equity markets in 2011. The S&P 500 ended at almost exactly the same price it began the year – its only return came from the 2.11% dividend paid by S&P 500 companies. Monthly returns ranged from a decline of 7.0% in September (completing five straight months of negative market returns), to an increase of 10.9% in October.
Stock markets worldwide generated negative returns for the first time in three years. Investors who utilize both domestic and foreign stock funds have lost money over the last five years. Fortunately, bond funds have generated 6.5% gains annually since 2006, and cash has helped with a 1.4% compound return.
The average market strategist interviewed by Barron’s at the beginning of 2011 predicted a gain of 11% for the markets last year. Also, they collectively predicted that stocks would outperform bonds, especially U.S. Treasuries.
The 2012 survey predicts a market gain of 11.5%. Two of the ten strategists are predicting flat to down markets, unlike 2011, where almost all predicted gains.
Worldwide Sovereign Debt at Unmanageable Levels
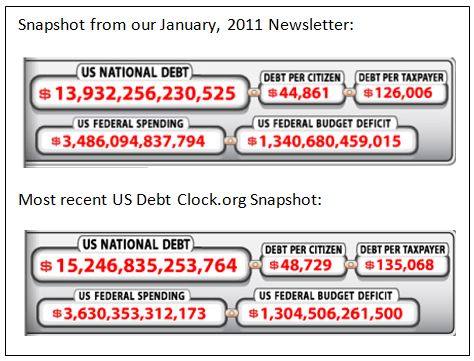
Time to laugh at ourselves…if only it were funny
 Other incredible statistics from usdebtclock.org:
- Total Federal/State/Local spending has exceeded $7.0 trillion dollars. That represents 46.7% of US Gross Domestic Product.
- Total US Debt (households, businesses, governments and financial institutions) has reached $56.5 trillion ($683,522 debt per family).
- US Unfunded Liabilities (promises made for Social Security, prescription drugs and Medicare, now exceeds $117 trillion, more than $1 million for each taxpayer.
- Hayman Capital Management provides a concise view of the debt situation for the rest of the world :
- Total global credit market debt has grown at a compound rate of 11% since 2002. Global real gross domestic product has grown only 4% during that same period.
- Total credit market debt is currently 310% of GDP (US Debt to GDP just surpassed 100% for the first time).
According to Hayman, “Throughout history, whenever total credit market debt breached 200% of GDP, it was commonly due to deficit spending fueled by borrowing as nations prepared for and fought wars. To the victor went the spoils (and debt pay-downs) and to the loser went defeat and default.”
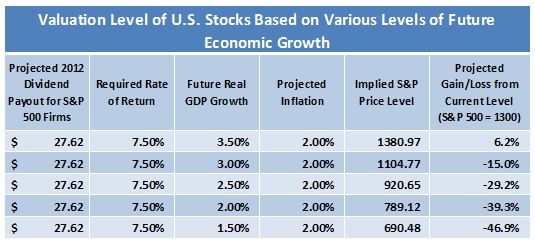
We are fixated on worldwide debt levels for one important reason: As more and more resources are pulled from future production and consumption capacity, lower long term potential growth rates are reduced. For example, if we use a standard financial calculation like a dividend discount valuation model , we see the following results:
 On January 18th, the World Bank cut its global growth forecast by the most in three years. The world economy will grow 2.5 percent this year, down from a June estimate of 3.6 percent, the Washington-based institution said. The euro area may contract 0.3 percent, compared with a previous estimate of a 1.8 percent gain. The U.S. growth outlook was cut to 2.2 percent from 2.9 percent.
________________________________________________
1. Hayman Capital Management, L.P November 30, 2011 Newsletter
2. The formula for the dividend discount valuation model:
(Dividend Payout)/(Required Rate of Return-(GDP Growth+Inflation))
