A Mountain Climber’s Perspective on Risk
Imagine you’re a mountaineer about to scale the face of El Capitan in Yosemite National Park. As you hike to the bottom of the face your level of risk to injury is relatively low. You might trip and fall on your hike but any injury is nonetheless negligible. In this situation, your exposure to downside risk is low while your upside potential is high.
As you begin your ascent the amount of downside risk you assume increases with each pull of the hand and push of your leg. As you near the top, you find yourself in a position with an incredible amount of downside risk with limited additional upside potential. Should you slip and fall, risk becomes a reality and you would no doubt be affected by the consequences.
As investors, we all understand that assuming a certain amount of “risk” within our portfolios is largely beneficial in the long run. We understand that increased exposure to risk combines additional volatility in the short run (risk) with greater returns in the long run (reward).
Risk is a fundamental element to our business model. We spend an exceptional amount of time thinking about risk and what implications it has for your assets. We bring this topic of risk up as a means to inform clients regarding our current understanding on the amount of risk in the market place for financial assets and why the level of risk is perceived to be where it is.
Short Term versus Long Term Returns
Stocks behave much differently in the short run than they do in the long run. Stocks in the short run are largely driven by human emotion. Short term reactions to business headlines, market rumors, etc. drive monthly, quarterly, or even yearly returns.
 Long-term total stock returns are the function of two items, corporate dividends and market price changes. Economic growth leads to increased corporate sales, leading to increased corporate profits and corporate dividends. Market price direction is highly dependent on the height of the mountain and your distance from the peak.
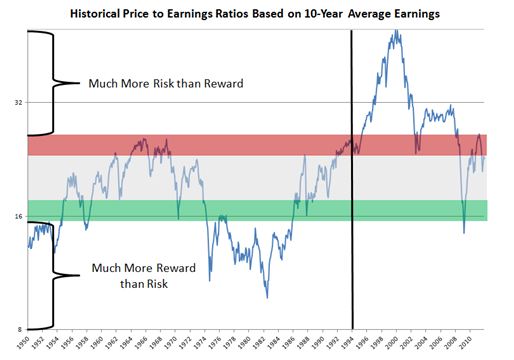
Let’s think about our mountain climber as we look at the graph at the bottom left. For a forty plus year period of time, from 1950 through the end of 1993, our mountains never went higher than the top of the red bar. At levels slightly above $25 for every $1 of corporate earnings, investors reached the peak, and the only way to head was down. After 1993, we decided the mountains should be much higher. At one point, our climber went as high as $50 for every $1 of earnings.
We looked at five year total rates of return for the S&P500. Prior to 1994, less than 2% of those five year returns were negative. From 1994 to the present, negative returns were experienced 33% of the time!
We believe we have returned to the lower (and safer) set of mountains we climbed pre-1994. However, we have climbed near the peak of those mountains, and as a result, we see limited upside potential and significant downside risk as we head into 2012.
