April 2015 – Starting Points Matter
Just a Reminder - Starting Points Matter
Investors continue to insist on paying ridiculous prices for common stocks, investment grade bonds, and the funds that invest in them. The financial salespeople (those NOT acting as fiduciaries for your assets) continue to tout justifications for these high prices by citing statistics that have absolutely no historical correlations with subsequent market returns. Remember, salespeople don’t make money if you don’t buy their products!
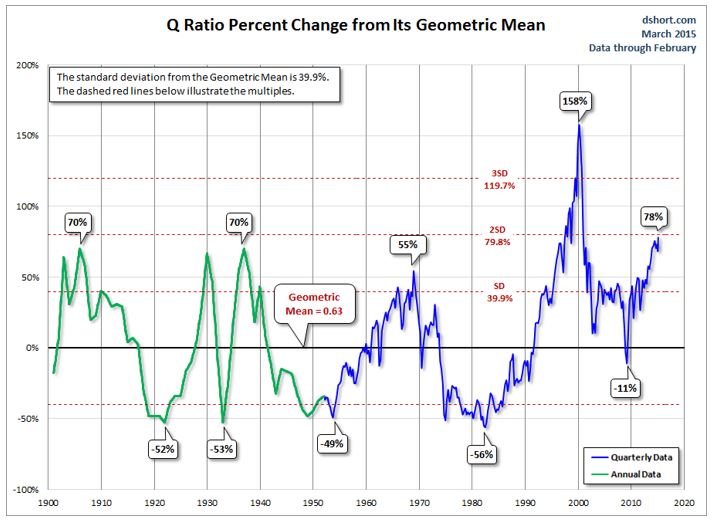
Below is just one reliable measure of long-term market valuation. The Q Ratio is a popular method of estimating the fair value of the stock market developed by Nobel Laureate James Tobin. The Q Ratio is the total price of the market divided by the replacement cost of all its companies.

Source: http://www.advisorperspectives.com/dshort/
Notice that we are nearly two standard deviations above the mean, and higher than every market peak since 1900 except for the 2000 technology bubble. From this starting point, reliable measure of future stock market returns (10 years out) suggest that the S&P 500 may actually be LOWER in 2025 than it is today – after dividends, we may see stock market returns of less than 2%.
We see little value in taking on the amount of risk most salespeople suggest is appropriate. We see plenty of value in protecting client assets through a conservative asset mix, and wait for a better starting point somewhere down the road.
Economic Trends to Ponder
- Since December 1999, total civilian employment among individuals 55 years of age and older has increased by 15.3 million jobs. Yet total civilian employment – including those over 55 – has grown by only 13.8 million jobs. This means exactly what you think: outside of workers 55 years of age and older, Americans of working age have 1.5 million fewer jobs than 15 years ago.
- In the investment sector, real gross private domestic investment has grown at a rate of just 1.5% annually since 1999 (versus a 4.7% real annual rate in prior decades), with growth of just 1% annually over the past decade.
- S. wages and salaries have plunged to the lowest share of GDP in history, while the civilian labor force participation rate has dropped to levels not seen since the 1970’s. Yet consumption as a share of GDP is near a record high.
Source: Hussman Funds - Eating Our Seed Corn: The causes of U.S. economic stagnation, and the way forward, March 23, 2015. http://hussmanfunds.com/wmc/wmc150330.htm
Key Market Returns and Returns by Investor Type
S&P 500
One Month........................... -1.58%
Year to Date.......................... 0.95%
One Year............................. 12.73%
Foreign Stocks
One Month........................... -1.52%
Year to Date.......................... 4.88%
One Year.............................. -0.92%
Investment Grade Bonds
One Month............................. 0.46%
Year to Date.......................... 1.61%
One Year............................... 5.72%
Conservative Index
One Month........................... -0.12%
Year to Date.......................... 0.77%
One Year............................... 2.63%
Moderately Conservative Index
One Month........................... -0.20%
Year to Date.......................... 1.48%
One Year............................... 4.23%
Moderate Index
One Month........................... -0.28%
Year to Date.......................... 2.27%
One Year............................... 5.74%
Moderately Aggressive Index
One Month........................... -0.35%
Year to Date.......................... 2.98%
One Year............................... 7.16%
Aggressive Index
One Month........................... -0.42%
Year to Date.......................... 3.66%
One Year............................... 8.60%
