June Newsletter – U.S. Treasury Yields Hit Historic Lows
U.S. Treasury Yields Hit Historic Lows

Bond Markets Flooded with Treasury Securities; Something Has to Give?
The benchmark 10 year treasury yield fell below 1.5 % on the morning of June 1st. According to Reuters, interest rates like this have not been seen since the early 1800’s – and as the saying goes: an unusual statistic requires an unusual explanation.
There are a few reasons U.S. government backed security prices are at all time highs with yields trading at all time lows. Among them is investors’ appetite for safety. The financial calamity in Europe and dismal U.S. economic data suggests the global economy has seen better days. With asset prices deflating, relatively small yields on government backed securities are seen as the best alternative to all other asset classes – a sobering proposition.
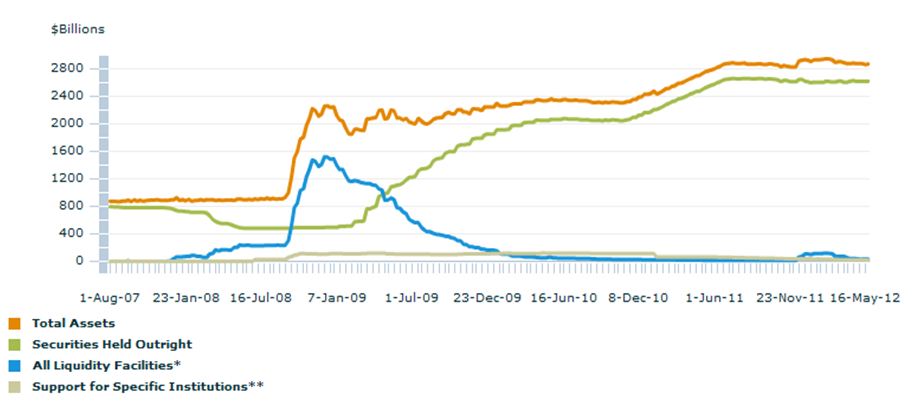
Additionally, the U.S. Federal Reserve has maintained its position in regards to monetary policy. The Fed has intended to keep interest rates low to stimulate risk taking among main street businesses. The table below highlights the Feds balance sheet since Aug. 2007. The green line represents the continued addition of open market securities (U.S. bonds) to the Feds balance sheet as a means to inflate bond prices while simultaneously deflating interest rates (source: Federal Reserve).

The Federal Reserve strategy to force investors to take risk has backfired. Look at the data on the left; risky assets like common stocks are down over the last year (foreign stocks are down 20%!) while more conservative bond portfolios have been the source of any return.
Some of the best and brightest financial minds in this country are rereading their textbooks, trying to figure out what part of their financial equations need tweaking. Meanwhile, we savers and investors are paying for their mistakes with low investment returns and NO low risk options to protect the purchasing power of our assets.
Indeed, something has to give – and the sooner the better.
“The future ain’t what it used to be.”
– Yogi Berra
Postponing Retirement
The age at which workers expect to retire is slowly rising. In 1991, just 11 percent of workers expected to retire after age 65. Twenty-one years later, in 2012, 37 percent of workers report they expect to wait until after age 65 to retire.
At the same time, the percentage of workers expecting to retire before age 65 has decreased from 50 percent in 1991 to 24 percent. -2012 Retirement Confidence Survey, Employee Benefit Research Institute and Mathew Greenwald & Associates
Understanding the Concept of Benchmarks
Why they are critical to the long term performance of your account
For most things in life, the saying “it’s all relative” is highly applicable, even so in the world of finance. Our goal in managing client portfolios is to produce the highest returns while assuming a relative level of risk appropriate for the individual.
Investor returns must be compared with something if we are to gauge our success in achieving this goal. We solve this problem by using various financial benchmarks. The purpose of a benchmark is to accurately reflect movement in value of an asset class without the interference of an outside influence. In other words, a benchmark offers objective data on the movement in price of an asset group without any manipulation or changes to the benchmarks underlying constituents by a human. This is meant to provide investors with a pure reflection of asset performance.
Benchmarks should be used by our clients as a way to gauge relative investment performance. If, say, your assets produce an investment return of 9% for one year, you might assume we are doing a great job. However, if the appropriate benchmark, tracking the same groups of assets, returned 12% for the same period, you might walk away with a different conclusion. Conversely, a small investment loss over a given period of time may be acceptable if the corresponding benchmark loses much more.
Equally as important, the proper use of a benchmark will help you avoid investment decisions based on irrational reactions to short term returns. Periods of negative returns often trigger a desire to reduce portfolio risk. However, if those negative returns are in line with the appropriate benchmark, the losses simply represent the realization of the risk you are willing to take; no change in strategy is necessary under this scenario.
The second quarter of this year is a perfect example. After a great first quarter of 2012, April and May have been difficult months. Conservative investors may have only experienced a small loss during this period, but moderate investors have suffered losses of 4.7% and aggressive investors may be down 8.8% or more.
If you are one of our clients, your benchmark is referenced in your annual Investment Policy Statement update. If you are managing your own account, please feel free to give us a call; we can help analyze the appropriate level of risk for your account and suggest the appropriate benchmark to use.
The “Q” Ratio and Current Market Valuation
This fundamental measure of the relationship of the market value of U.S. equities divided by replacement cost shows that the current market is valued 23% higher than the long run average, even after the declines of April and May.
For reference, at the peak of the tech bubble, values were 155% above their long run average. After the declines we experienced in 2008 and early 2009, the market fell to a level 9% below their long run average.
More information on this data can be found in Doug Short’s analysis of June 1, 2012. Read the Article
